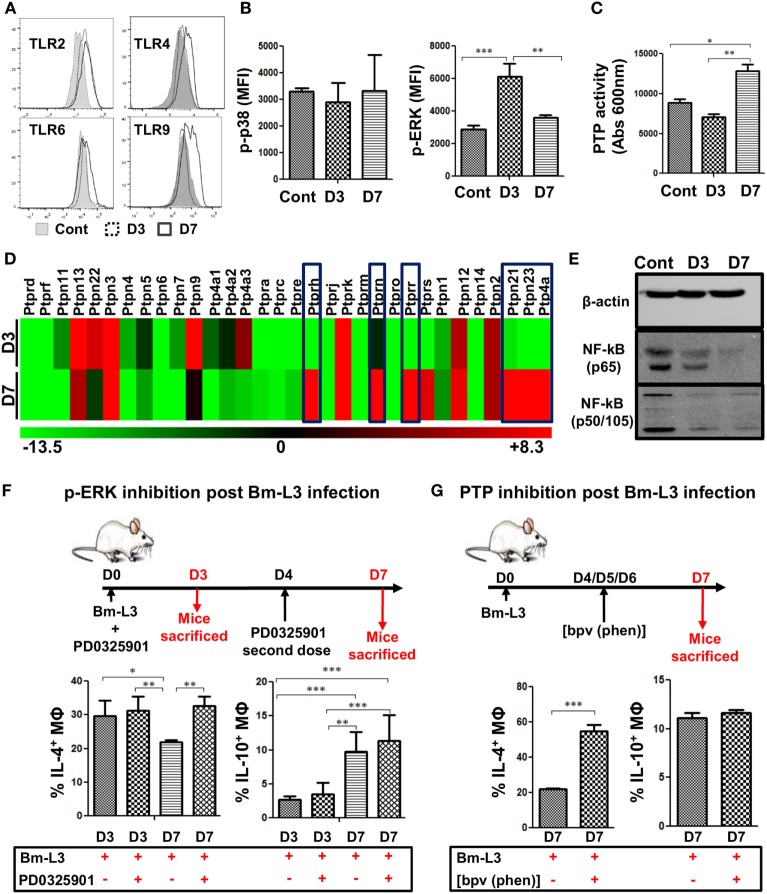
Figure 3.
Bm-L3 infection impairs signaling in host MΦs. (A) Histograms represent expression of different toll like receptors (TLRs) on splenic MΦs from uninfected control and Bm-L3-infected mice at day 3 and day 7 p.i. (B) Phosphorylation of p38 and ERK in FACS-sorted splenic MΦs from uninfected control and Bm-L3 infected mice at day 3 and day 7 p.i. is shown. Values represent mean fluorescence intensity (MFI) values at given time points. (C) Bar graph represents protein tyrosine phosphatases (PTP) activity in FACS-sorted splenic MΦs in uninfected control and Bm-L3-infected mice at day 3 and day 7 p.i. (D) Heat map showing fold change (red-upregulated and green-downregulated of different PTPs in flow-sorted splenic MΦs at day 3 and day 7 post Bm-L3 infection as compared to uninfected control). (E) Representative western blot showing expression of β-actin, NFκB-p65, and NFκB-p50/105 in uninfected control and Bm-L3-infected mice at day 3 and day 7 p.i. (F) Schematic representation of the experimental strategy used for the inhibition of Erk. Bm-L3-infected mice were administered MEK inhibitor, PD0325901 at day 0 and day 4 p.i., and immunological assessments were made at day 3 and day 7 p.i., respectively. Figure depicts the percentages of IL-4 and IL-10 secreting MΦs at day 3 and day 7 before and after Erk inhibition. (G) Schematic representation of the experimental strategy used for the depletion of PTP activity. Bm-L3-infected mice were administered [bpv (phen)] daily from day 4 p.i. to day 6 p.i. and immunological assessments were made at day 7 p.i. Figure depicts the percentages of IL-4 and IL-10 secreting MΦs at day 7 before and after PTP inhibition. Values in (B,C,F,G) represent mean ± SD values from two independent experiments with at least 3–4 animals/group. p-Value of ≤0.05, ≤0.01, and ≤0.001 was considered significant, highly significant, and very highly significant and marked with *, **, and ***, respectively.

