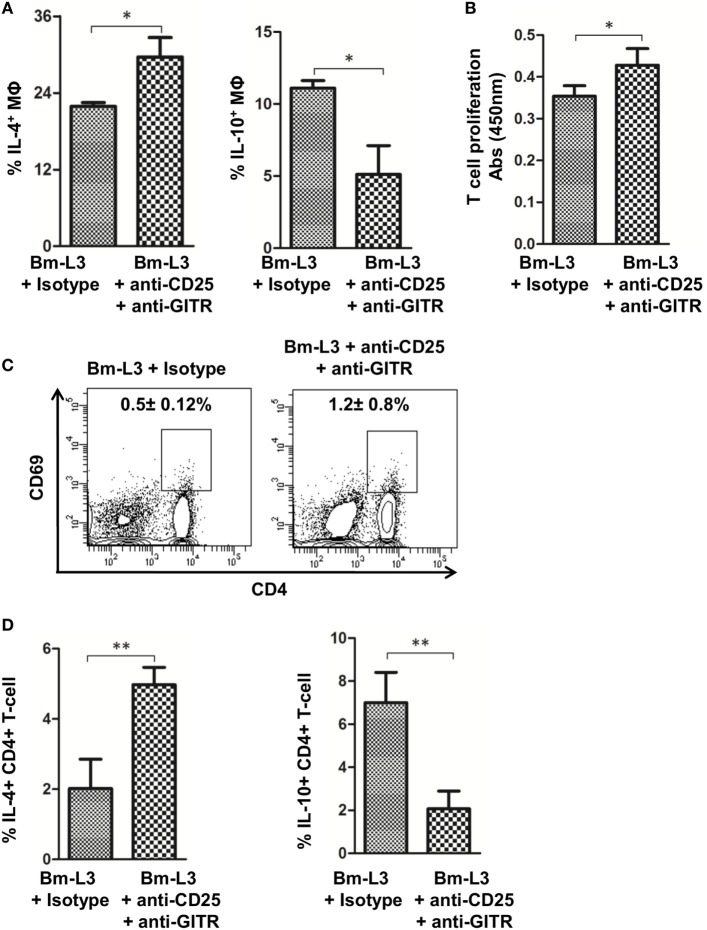
Figure 5.
Neutralization of regulatory T-cell activity prevents polarization of splenic MΦs. (A) Bar graphs represent percentages of FACS-sorted splenic MΦs-secreting cytokines IL-10 and IL-4 from anti-CD25 + anti-GITR-treated mice or uninfected IgG control at day 7 p.i. (B) Mitochondrial activity, as a measure of T cell proliferation was assessed by XTT assay. Figure represents OD values of FACS-sorted splenic MΦs cocultured with naïve CD4+T cells at 450 nm at indicated time points from anti-CD25 + anti-GITR treated mice or uninfected IgG control at day 7 p.i. (C) Representative flow cytometry dot plots showing percentages of activated CD4+ T cells from anti-CD25 + anti-GITR treated mice or uninfected IgG control at day 7 p.i. (D) Bar graphs represent percentages of CD4+ T cells secreting cytokines IL-10 and IL-4 from anti-CD25 + anti-GITR treated mice or uninfected IgG control at day 7 p.i. All values represent mean ± SD values from three independent experiments with at least 3–4 animals/group. p-Value of ≤0.05, ≤0.01, and≤0.001 was considered significant, highly significant and very highly significant and marked with *, **, and ***, respectively.

