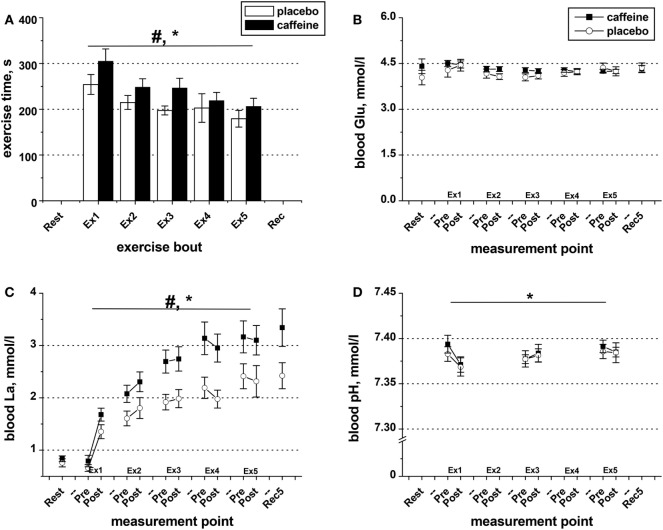
Figure 2.
Exercise duration and blood metabolite data. (A) Population average (±SEM, n = 9) time of exercise to task failure throughout the five sets (Ex1–Ex5) completed by the participants 1 h after taking caffeine (filled bars) or placebo (open bars) supplements. Changes in blood pH (D) as well as in the concentrations of glucose (B) and lactate (C) in the blood samples collected before and after each exercise set in the trials with caffeine (black squares) and placebo (open circles); ANOVA, p < 0.05: #main condition effect; *main time effect; †set × time interaction effect.

