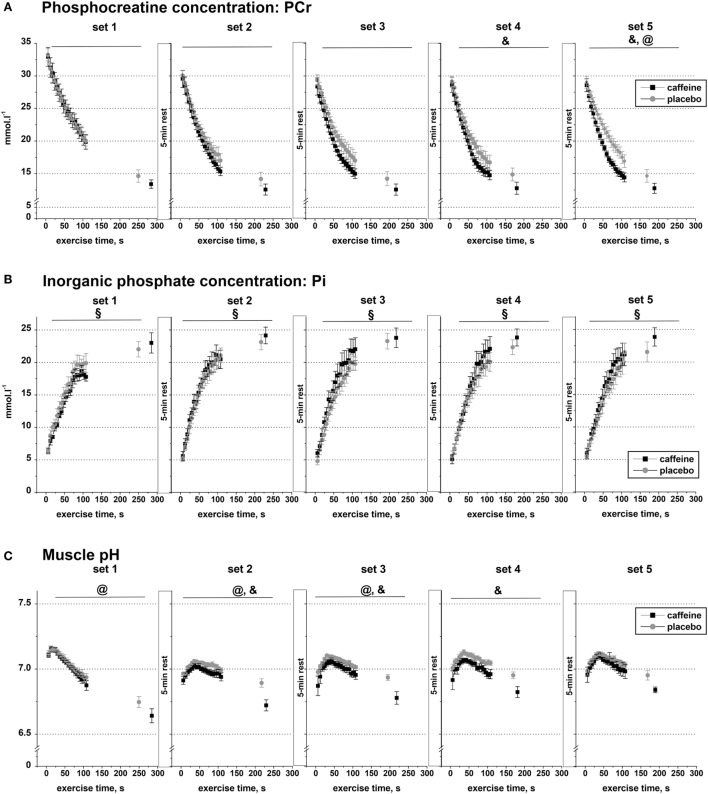
Figure 3.
Muscle metabolite data. Population average (±SEM, n = 9) timeline of the changes in the concentrations of phosphocreatine (A), inorganic phosphate (B), and muscle pH (C) throughout the five sets of exercise (sets 1–5) completed to task failure by the participants 1 h after taking caffeine (black squares) or placebo (open circles) supplements. 31P-MRS spectra were calculated for every 6.0 s and are shown continuously up to 110 s of exercise together with their levels at the respective times of exhaustion; post hoc p < 0.05: &condition effect; §time effect; @condition by time interaction effect.

