FIGURE 2.

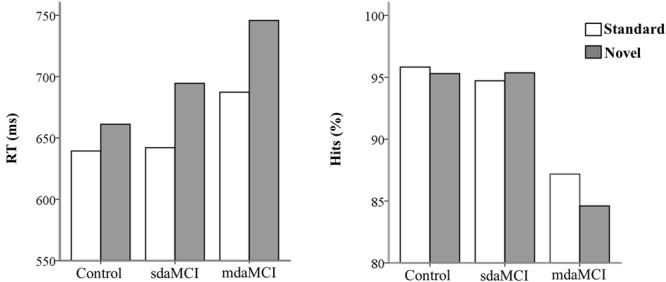
Mean values of reaction times (RT, in ms- left figure) and percentage of hits (right figure) in each condition (Novel and Standard) in all three groups (Control, sdaMCI, and mdaMCI).

Mean values of reaction times (RT, in ms- left figure) and percentage of hits (right figure) in each condition (Novel and Standard) in all three groups (Control, sdaMCI, and mdaMCI).