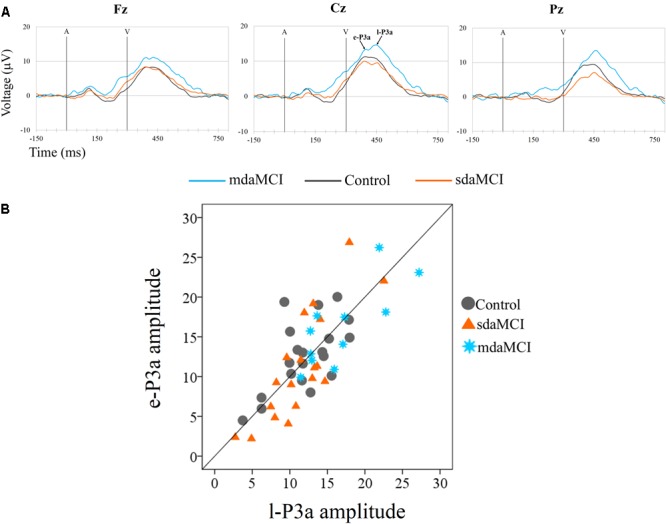
FIGURE 5.

(A) Grand-average ERP waveforms at the Fz, Cz, and Pz electrode sites, in the Novel minus Standard (N-S) difference waveforms, for the three groups (Control, sdaMCI, and mdaMCI). A, auditory stimulus; V, visual stimulus. Digital bandpass filter: 0.1–20 Hz. (B) Scatter plot of individual dates (in the three groups) for amplitudes of e-P3a and l-P3a, at Cz electrode site, in the N-S difference waveforms.
