FIGURE 6.

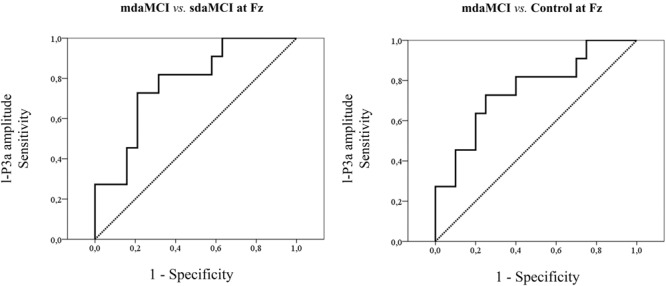
ROC curves for the amplitudes that yielded the highest sensitivity and specificity values for each type of ROC analysis.

ROC curves for the amplitudes that yielded the highest sensitivity and specificity values for each type of ROC analysis.