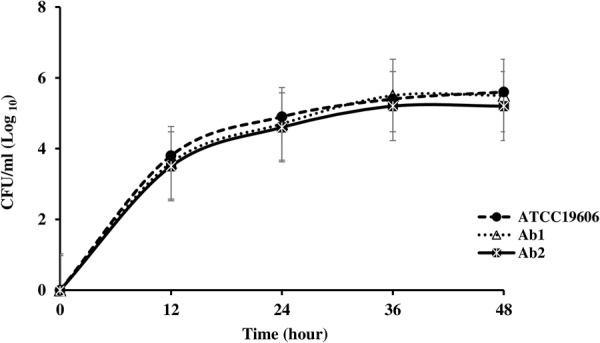
FIGURE 3.

Growth curves of reference strain ATCC 19606 and colistin-susceptible isolate: Ab1 and respective colistin-resistant isolate: Ab2. The growth rates between ColR isolate, Ab1, and their respective ColS isolate, Ab2, were not significantly different at any time points (P > 0.05).
