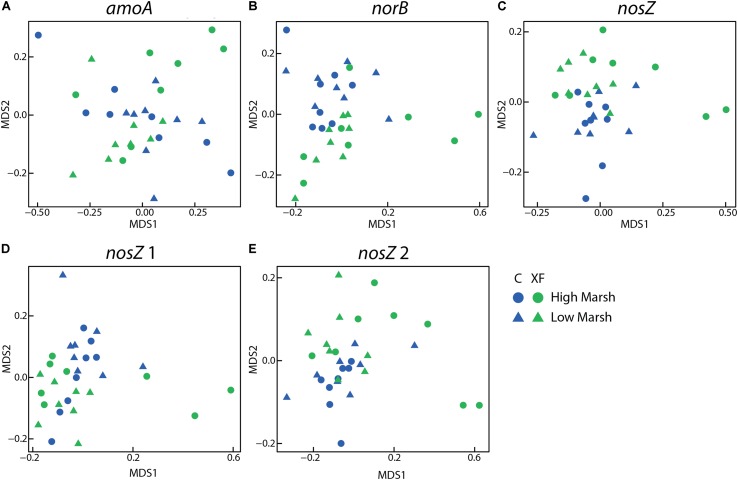
FIGURE 3.
Non-metric multidimensional scaling (NMDS) plots of RFR microarray data for AOA amoA (A), norB (B), nosZ (C), atypical nosZ 1 (D), and atypical nosZ 2 (E). All but AOA amoA differ significantly by treatment using adonis. None differ significantly by habitat or depth. Each figure includes eight samples (2 depths × 2 habitats × 2 duplicate cores) per plot and there were four plots (two control and two XF-fertilized plots).

