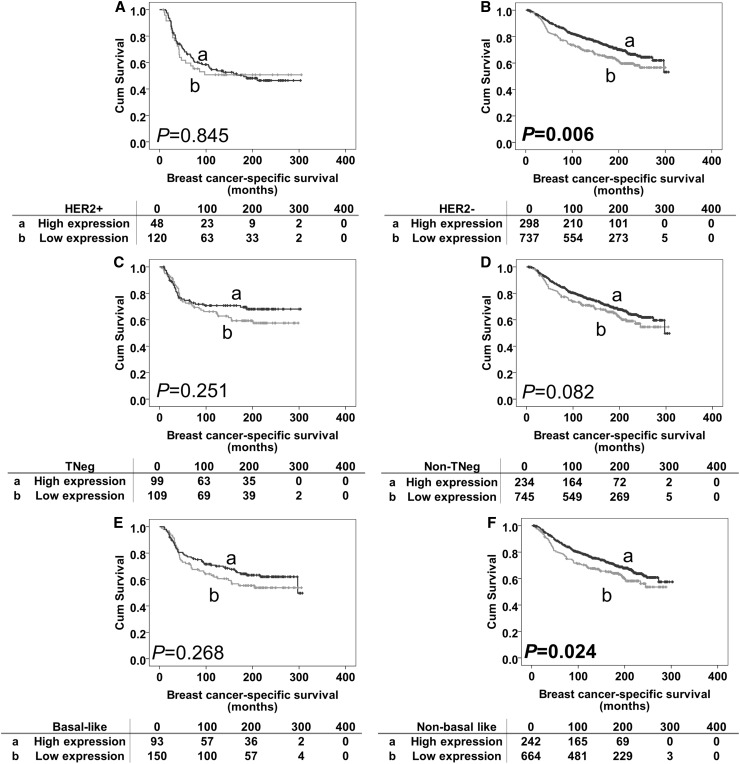
Fig. 3.
Kaplan–Meier survival curves for breast cancer-specific survival based on MSK1 expression in subgroups. Panel A: subgroup analysis of HER2-positive disease with high MSK1 expression (a) and low MSK1 expression (b). Panel B: subgroup analysis of HER2-negative disease with high MSK1 expression (a) and low MSK1 expression (b). Panel C: subgroup analysis of triple-negative disease with high MSK1 expression (a) and low MSK1 expression (b). Panel D: subgroup analysis of non-triple-negative disease with high MSK1 expression (a) and low MSK1 expression (b). Panel E: subgroup analysis of basal-like disease with high MSK1 expression (a) and low MSK1 expression (b). Panel F: subgroup analysis of non-basal-like disease with high MSK1 expression (a) and low MSK1 expression (b). The numbers below the survival curves are the number of patients at risk at the specified month

