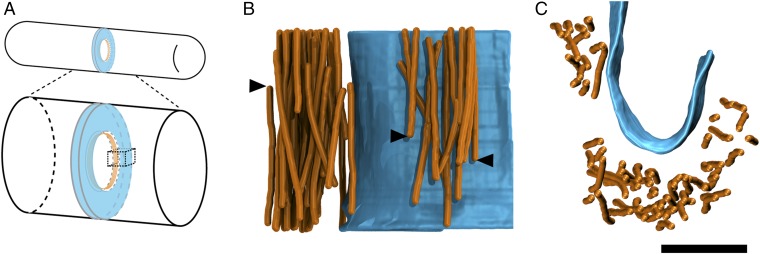
Fig. 4.
The 3D segmentations of tomographic reconstructions. (A) Schematic of S. pombe division septum (blue) and the AMR (orange) at the leading edge. The dashed cube indicates the portion of the septum represented by the 3D segmentations in B and C. (B) Side view of segmented tomographic reconstruction of actin filaments (orange) and the membrane (blue) from a transverse section through the AMR. Arrowheads point to filaments that terminate within the section. (C) Top view of the same segmentation as in B. (Scale bar: 100 nm.)

