Fig. 6.
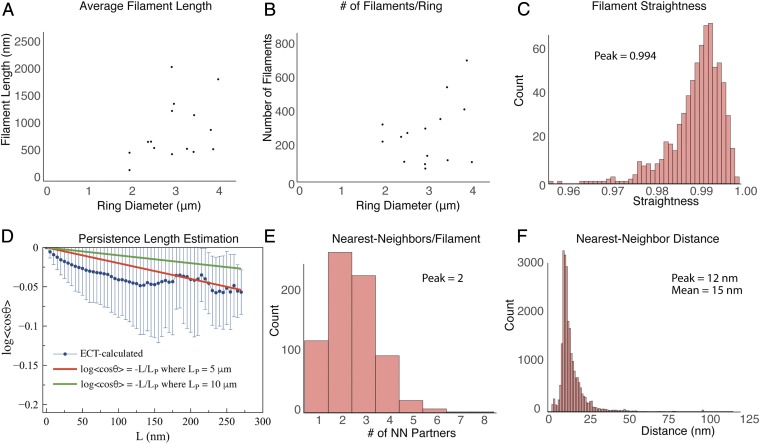
Quantitative analysis of contractile ring filaments. (A) Scatter plot of the estimated filament length as a function of ring diameter. (B) Scatter plot of the estimated number of filaments per ring as a function of ring diameter. (C) Histogram of filament straightness, defined as the ratio of the end-to-end distance to the contour length of the filament (see Experimental Methods for details). (D) Plot of the persistence length of actin filaments in the tomograms (blue points) compared with the plotted formulas for persistence length equal to 5 μm and 10 μm (the known value for free actin in solution). Error bars indicate SD. (E) Histogram of nearest-neighbor distances between the filaments. Each filament was modeled as a chain of beads. Pairs of beads on the same filaments were excluded from the calculation. (F) Histogram of the number of nearest-neighbor partners for each filament in the tomograms. Except for A and B, data were combined from all 22 segmented tomograms (740 total filaments). The bin size is 0.1 in C, and 1 nm in E.

