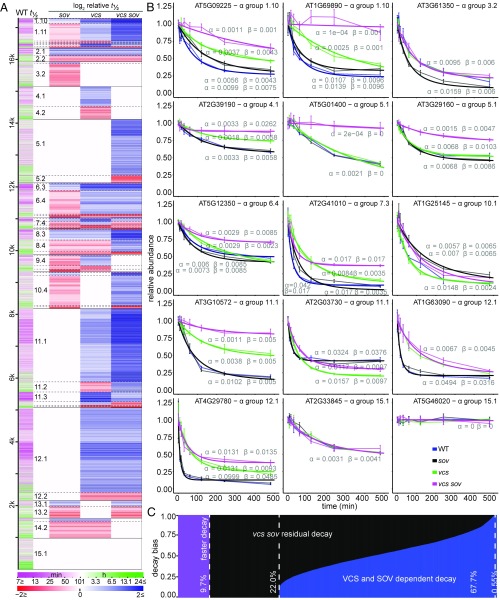
Fig. 2.
Substrates for mRNA Decapping and SOV. (A) Genotypic effects on decay rate. Predominant patterns were revealed by genotype half-life comparisons presented as a heatmap. Transcript half-life in WT is represented in the first column. Relative stabilization or destabilization is presented in the remaining four columns as log2 half-life relative to WT (WT, sov, vcs, vcs sov). Transcripts (rows) are ordered by α groups, which are divided by solid black lines. Subgroups are defined by dashed lines, and large subgroups are labeled in the second column. (B) Representative transcript decay profiles: relative RNA abundance following inhibition of transcription (thin lines, mean ± SE, n = 4; thick line, modeled values). The α and β parameters are listed near each model line (blue, WT; black, sov; green, vcs; pink, vcs sov). (C) Genome-wide contributions of VCS and SOV to mRNA stability based on the relative decay rate decrease (blue) and residual decay rate (black) in vcs sov. Transcripts with faster decay in vcs sov are represented in purple.

