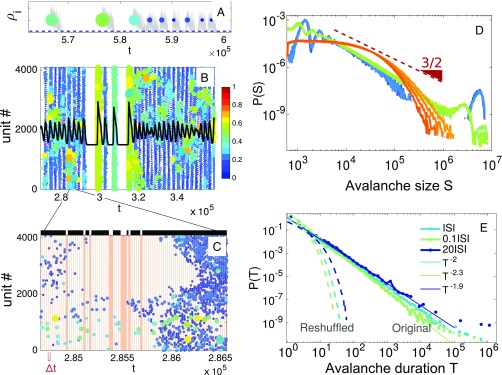
Fig. 5.
Avalanches measured from activity time series. (A) Illustration of the activity time series (gray color) at a given unit . By establishing a threshold value (dashed blue line close to the origin), a single “event” or “unit spike” is defined at the time of the maximal activity in between two threshold crossings (note that the forthcoming results are robust to changes in this criterion) (SI Appendix); a weight equal to the area covered in between the two crossings is assigned to each event (note the color code). This allows us to map a continuous time series into a discrete series of weighted events. The time distance between two consecutive events is called ISI. (B) Raster plot for a system with units obtained using the procedure above for each unit. Observe that large events coexist with smaller ones and that these last ones occur in a rather synchronous fashion. The overall time-dependent activity is marked with a black curve. (C) Zoomed-in view of a part of B illustrating the time-resolved structure and using a time binning equal to the network-averaged ISI. Shaded columns correspond to empty time bins (i.e., with no spike). Avalanches are defined as sequences of events occurring in between two consecutive empty time bins, and they are represented by the black bars above the plot. (D) Avalanche size distribution (the size of the avalanche is the sum of the weighted spikes that it comprises) for diverse values of (from to in shades of blue, from to in shades of green, and from to in shades of orange) measured from the raster plot . The (red) triangle, with slope , is plotted as a reference, illustrating that, near criticality, a power law with an exponent similar to the experimentally measured one is recovered. Away from the critical point, either in the synchronous phase (shades of blue) or in the asynchronous one (shades of orange), clear deviations from power law behavior are observed. Observe the presence of “heaps” in the tails of the distributions, especially in the synchronous regime; these correspond to periodic waves of synchronized activity (SI Appendix). They also appear at criticality but at progressively larger values for larger system sizes. (E) Avalanche duration distribution determined with different choices of the time bin. The experimentally measured exponent is reproduced using , whereas deviations from such a value are measured for smaller (larger) time bins in agreement with experimentally reported results. After reshuffling times, the distributions become exponential ones, with characteristic timescales depending on (dashed lines).

