Fig. 4.
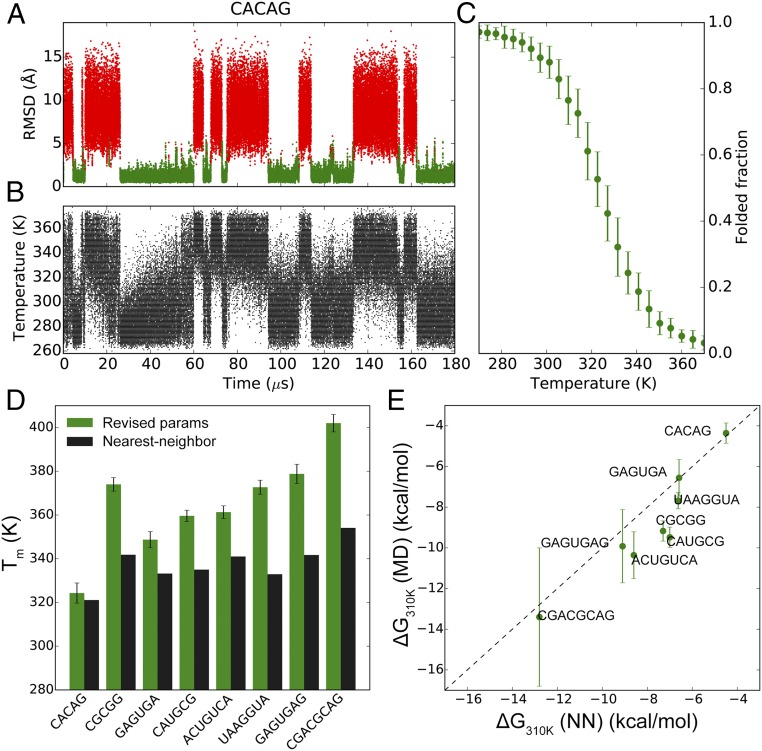
MD simulations of RNA duplexes. (A) Nonhydrogen rmsd trace of the CACAG RNA duplex. The folded (green) and unfolded (red) states of the duplex are indicated. (B) The time evolution of temperatures in the simulated tempering MD simulation of the CACAG duplex. (C) Melting curve of the CACAG duplex. The rmsd traces and melting curves of all eight RNA duplexes are in SI Appendix, Fig. S12. (D) Tm values of the eight RNA duplexes calculated from the MD trajectories. In black are the Tm values estimated with the NN model (45). (E) ΔG310 K values calculated from the MD trajectories (by fitting to the nonlinear van’t Hoff equation) compared with those estimated with the NN model. The lowest temperatures in the simulated tempering simulations of GAGUGAG and CGACGCAG were higher than 310 K, so for these duplexes the ΔG310 K values were extrapolated from the fitted lnKeq – 1/T curves.

