Fig. 1.
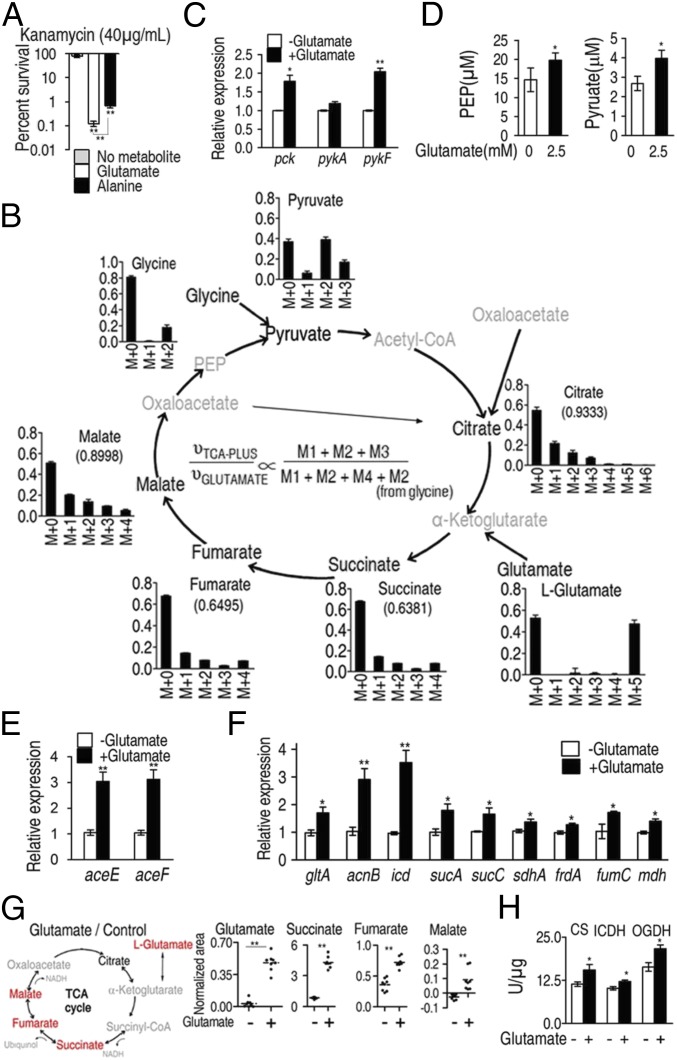
The P cycle in E. tarda. (A) Percent survival of E. tarda EIB202. Cells were grown in LB medium and then incubated in M9 medium with acetate (10 mM) in the presence or absence of glutamate (2.5 mM) or alanine (40 mM) plus kanamycin (40 μg/mL). (B) Mass isotopomer distributions in EIB202. Cells were grown in LB medium and then incubated in M9 medium plus acetate (10 mM) with 13C-labeled glutamate (1.25 mM) and unlabeled glutamate (1.25 mM). Please see SI Appendix, Text S2 for detailed interpretation of this result. (C) Expression of pck, pykA, and pykF of EIB202, which was determined by qRT-PCR. Cells were grown in LB medium and then incubated in M9 medium with acetate (10 mM) in the presence or absence of glutamate (2.5 mM). (D) PEP and pyruvate abundance of EIB202, which was determined by UPLC/MS. Cells were grown in LB medium and then incubated in M9 medium with acetate (10 mM) in the presence or absence of glutamate (2.5 mM). (E and F) Expression of aceE and aceF (E) and genes in the TCA cycle (F) of EIB202, which was determined by qRT-PCR. Cells were grown in LB medium and then incubated in M9 medium with acetate (10 mM) in the presence or absence of glutamate (2.5 mM). (G) Scatterplot of abundance of the indicated metabolites, which were analyzed by GC-MS. Red, increased metabolites; black, unchanged metabolite; gray, undetected metabolites. Each dot represents a biological or technical replicate. (H) Activity of citrate synthase (CS), isocitrate dehydrogenase (ICDH), and α-oxoglutarate dehydrogenase (OGDH). Cells were grown in LB medium and then incubated in M9 medium with acetate (10 mM) in the presence or absence of glutamate (2.5 mM). Information on these genes and their encoding enzymes is described as follows: aceE and aceF, pyruvate dehydrogenase complex E1 and E2, respectively; acnB, aconitase; frdA, fumarate reductase subunit; fumC, fumarase; mdh, malate dehydrogenase; gltA, citrate synthase; icd, isocitrate dehydrogenase; pck, phosphoenolpyruvate carboxykinase; pykA and pykF, pyruvate kinases 2 and 1, respectively; sdhA, succinate dehydrogenase subunit; sucA, α-oxoglutarate dehydrogenase subunit; and sucC, succinyl-CoA synthetase. Results (A and C–H) are displayed as mean ± SEM; at least three biological repeats were carried out. Statistically significant values are indicated with asterisk (*P < 0.05, **P < 0.01) and determined by Student’s t test.

