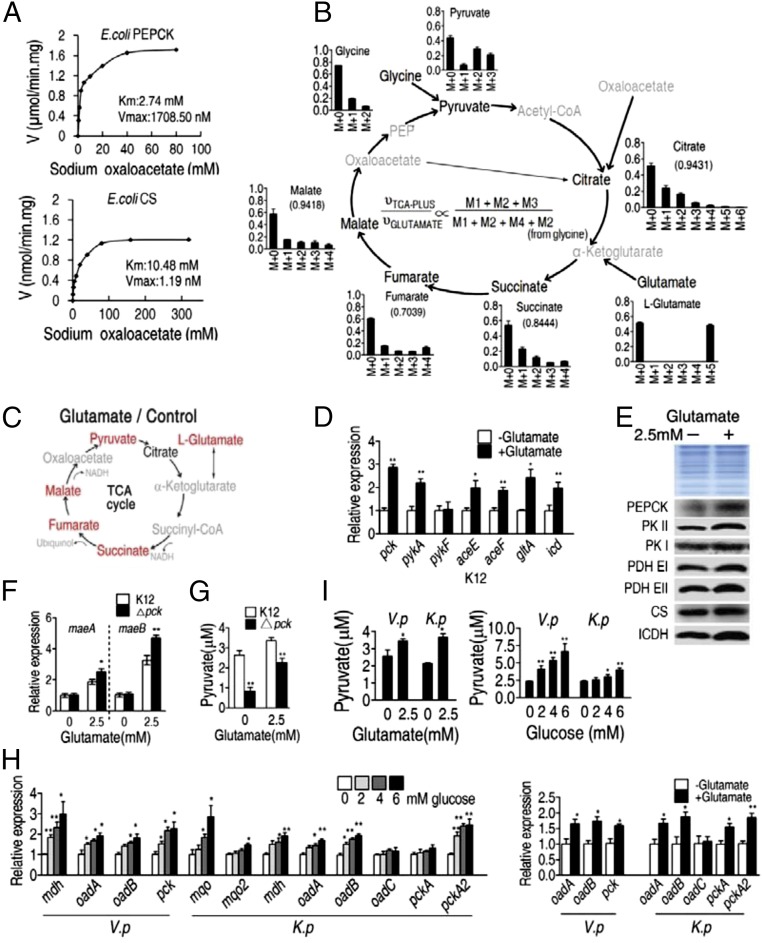
Fig. 5.
The P cycle in E. coli. (A) Kinetic analysis of E. coli PEPCK and E. coli citrate synthase (CS) with oxaloacetate (0.625, 1.25, 2.5, 5, 10, 20, 40, 80 mM and 1.25, 2.5, 5, 10, 20, 40, 80, 160, 320 mM, respectively) as substrate at the indicated concentration. Cells were grown in LB medium and then incubated in M9 plus acetate (10 mM). (B) Mass isotopomer distributions in E. coli. Cells were grown in LB medium and then incubated in M9 medium plus acetate (10 mM) with 13C-labeled glutamate (1.25 mM) and unlabeled glutamate (1.25 mM). Black, 13C-labeled metabolites; gray, undetected metabolites. (C) Metabolites with increased abundance (in red) in the TCA cycle, which were detected by GC-MS. Cells were grown in LB medium and then incubated in M9 medium plus acetate (10 mM) with and without glutamate (2.5 mM). Gray, undetected metabolites. Each dot represents a biological or technical replicate. (D and E) Expression of the indicated genes (D) and proteins (E) determined by qRT-PCR and Western blot, respectively. Cells were grown in LB medium and then incubated in M9 medium plus acetate (10 mM) with and without glutamate (2.5 mM). pck, pykA, pykF, aceE aceF, gltA, icd encode PEPCK, PKII, PKI, PDH E1, PDH EII, CS, ICDH, respectively. (F and G) Expression of malic enzyme (F) and intracellular pyruvate (G) in ∆pck and E. coli K12. Genes maeA and maeB encode NAD-dependent malic enzyme and NADP-dependent malic enzyme, respectively. Cells were grown in LB medium and then incubated in M9 medium plus acetate (10 mM) with and without glutamate (2.5 mM). (H) Expression of malic enzyme, oxaloaceate decarboxylase and PEPCK genes in V. parahaemolyticus or K. pneumonia. Cells were grown in LB medium and then incubated in M9 medium plus acetate (10 mM) with and without the indicated concentrations of glucose. (I) Intracellular pyruvate in V. parahaemolyticus (V. p) or K. pneumonia (K. p). Cells were grown in LB medium and then incubated in M9 medium plus acetate (10 mM) with and without glutamate (2.5 mM) or the indicated glucose concentrations. Results (D and F–I) are displayed as mean ± SEM, and three biological repeats were carried out. Statistically significant values are indicated by asterisk (*P < 0.05, **P < 0.01) and were determined by Student’s t test.

