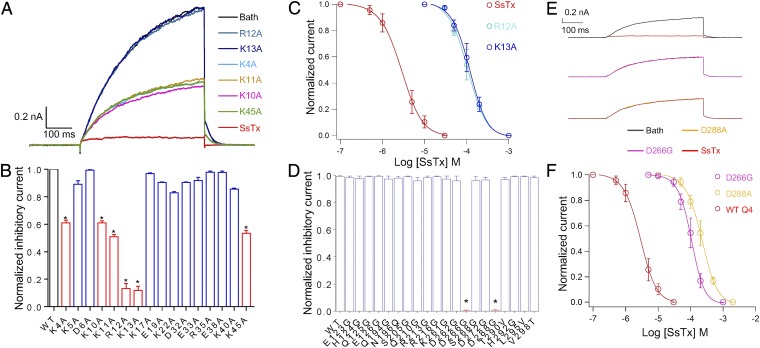
Fig. 2.
Key residues involved in the interaction between SsTx and KCNQ4. (A) Representative whole-cell KCNQ4 currents from the same HEK293T cell recorded in the presence of 10 μM of WT SsTx and single point mutants (K4A, K10A, K11A, R12A, K13A, and K45A) sequentially. Before applications of each compound, the cells were perfused by bath solution for 30 s to ensure that the currents return to the same level. (B) Normalized inhibitory currents of 50 μM WT SsTx (n = 3) and 50-μM toxin mutants (n = 10). *P < 0.05 compared with WT group. (C) Inhibition of KCNQ4 by various concentrations of WT SsTx, R12A, and K13A. The data were fit to a Hill equation, and the IC50 and slope factor values are 2.5 ± 0.4 μM and 1.18 ± 0.05 (n = 5 cells) for WT SsTx, 104.7 ± 5.4 μM and 2.05 ± 0.09 (n = 5 cells) for R12A mutants, and 117.5 ± 6.1 μM and 1.93 ± 0.08 (n = 5 cells) for K13A mutants. (D) The normalized inhibitory currents of WT KCNQ4 (n = 3) and point mutants (n = 5) at extracellular domains in the presence of 31.6 μM SsTx. *P < 0.05 compared with the WT group. (E) Representative whole-cell WT KCNQ4 (Top), D266G (Middle), and D288A (Bottom) currents recorded in the presence of 10 μM SsTx. (F) Dose–response relationships of SsTx against WT KCNQ4, D266G, and D288A. Smooth curves are fit of data points to the Hill equation. The IC50 and slope factor values are 2.5 ± 0.4 μM and 1.18 ± 0.05 (n = 5 cells) for WT SsTx, 108.2 ± 6.3 μM and 2.11 ± 0.09 (n = 5 cells) for D266G mutants, and 218.8 ± 7.6 μM and 1.76 ± 0.08 (n = 5 cells) for D288A mutants. Average values represent means ± SEMs.

