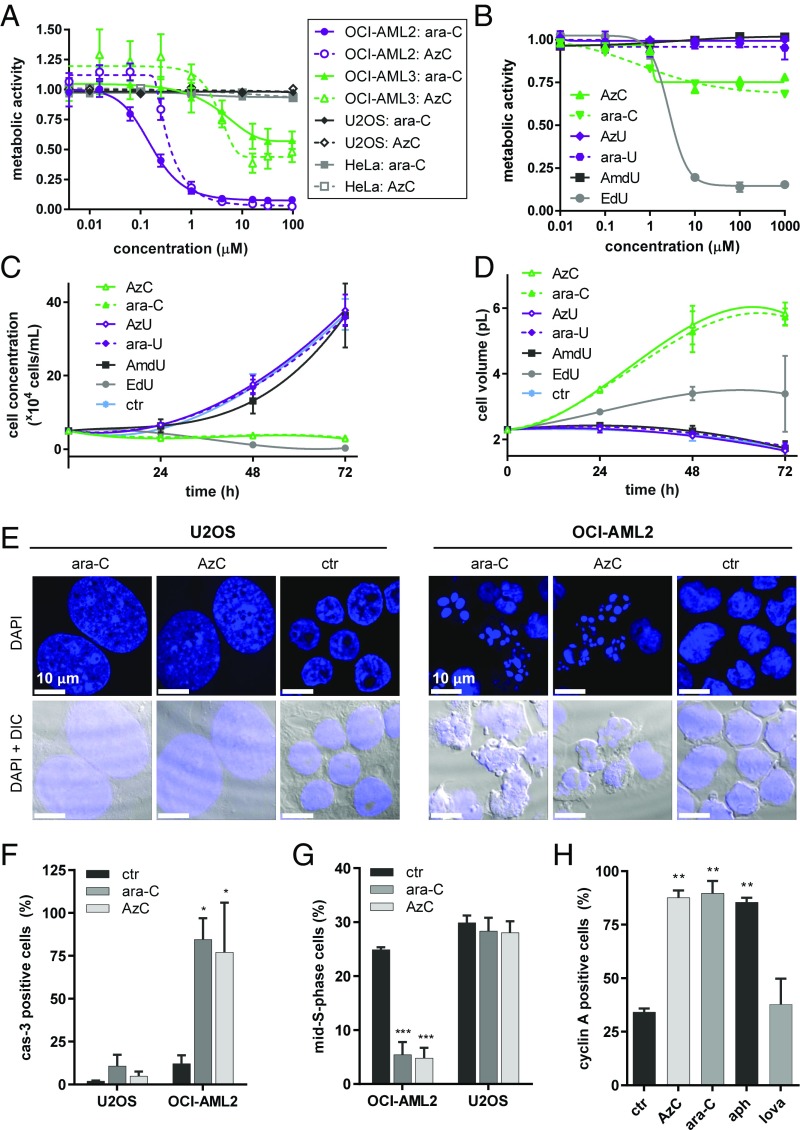
Fig. 2.
Similar biological profiles of ara-C and AzC in cell cultures according to changes in metabolic activities, cell counts, volumes, morphologies, caspase-3 activations, and cell-cycle populations. (A) Changes in total metabolic activities according to the Alamar Blue assay of four different cell lines following 24-h incubations with ara-C or AzC. (B) Changes in total metabolic activities of U2OS cells following 72-h incubations with ara-C, AzC, ara-U, AzU, AmdU, or EdU (see SI Appendix, Figs. S1 and S2 for results obtained using OCI-AML2, OCI-AML3, and HeLa cells). (C) Counting of viable U2OS cells following treatment with 30 μM of each nucleoside for 0–72 h. (D) Average volumes (pL) of U2OS cells treated with 30 μM of each nucleoside for 0–72 h according to piezoelectric measurements. (E) Microscopy images of OCI-AML2 cells (+1 µM of ara-C or AzC for 24 h) or U2OS cells (+30 µM of ara-C or AzC for 72 h) fixed and stained with DAPI (see SI Appendix, Fig. S4 for the results obtained using HeLa and OCI-AML3 cells). (F) Caspase-3 activation in viable U2OS cells (+30 µM of ara-C or AzC for 24 h) or OCI-AML2 cells (+5 µM of ara-C or AzC for 8 h). (G) Percentage of mid-S-phase cells according to DAPI staining and flow cytometry analysis of OCI-AML2 (+5 μM of ara-C or AzC for 8 h) or U2OS (+30 µM of ara-C or AzC for 24 h). (H) Cyclin A activation in viable U2OS cells treated with ara-C or AzC (30 µM), aphidicolin (aph, 10 µM, positive control), or lovastatin (lova, 40 µM, negative control) for 24 h. *P < 0.1, **P < 0.01, and ***P < 0.001 versus the control.

