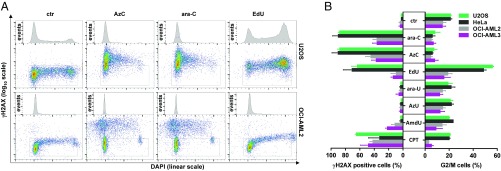
Fig. 3.
Similar biological profiles of ara-C and AzC according to changes in γH2AX formation, DNA content, and cell-cycle impact. (A) Representative flow cytometry data of γH2AX versus DAPI staining of cells treated with AzC, ara-C, or EdU. Negative control samples (ctr) received no nucleoside, but were otherwise treated identically. (B) Percentage of γH2AX positive cells, and percentage of cells in G2/M phase for U2OS, HeLa, OCI-AML2, or OCI-AML3 cells treated with ara-C, AzC, EdU, ara-U, AzU, AmdU, or CPT. See SI Appendix, Fig. S9 for experimental details and raw flow cytometry data. Mean values ±SD of three independent experiments are given.

