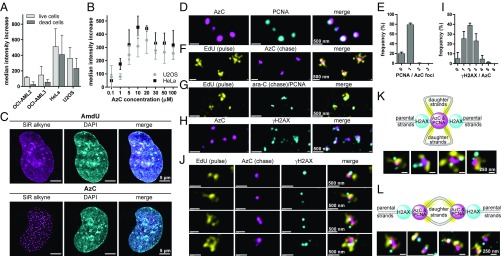
Fig. 5.
Metabolic incorporation and fluorescent staining of AzC reveals the architecture of drug-stalled replication foci using superresolution microscopy. (A) Flow cytometry analysis of AzC staining intensities of four cell lines treated with 5 µM of AzC for 24 h and stained using Alexa 594 alkyne. Samples were measured at identical laser voltage and detector gain settings. The median fluorescence intensity values ±SD are given with respect to controls receiving no nucleoside. (B) AzC concentration-dependent staining of HeLa and U2OS cells by Alexa 594 alkyne. (C) Superresolution (gSTED) images of U2OS cells treated with 30 µM of AzC or 30 µM of AmdU for 24 h, fixed, and stained with SiR alkyne. (D) gSTED images of U2OS cells incubated with 50 μM of AzC for 5 h, fixed, denatured, immunostained with anti-PCNA primary antibody and Alexa 594-containing secondary antibody; AzC was stained using SiR alkyne. (E) Average number of PCNA foci per AzC punctum (n = 331) in three whole cells from three independent biological replicates. (F) gSTED images of U2OS cells incubated with 10 µM of EdU for 20 min, washed, and incubated with 50 µM of AzC for 5 h. Cells were then fixed, denatured, and EdU was stained using TAMRA azide and AzC was stained using SiR alkyne. (G) gSTED images of U2OS cells incubated with 10 µM of EdU for 20 min, washed, and incubated with 50 µM ara-C for 5 h. Cells were then fixed, denatured, and stained for PCNA and EdU. (H) gSTED images of U2OS cells treated with 50 μM of AzC for 5 h. Cells were then fixed, denatured, immunostained with anti-γH2AX primary antibody and an ATTO 594-containing secondary antibody, and AzC was stained with SiR alkyne. (I) Average number of γH2AX foci per AzC punctum (n = 487) in three whole U2OS cells. (J) gSTED images of U2OS cells treated with 10 µM of EdU for 20 min, washed, and incubated with 50 µM of AzC for 5 h. Cells were then fixed, denatured, and stained for γH2AX, EdU, and AzC as above. (K) Model and examples of stalled replication foci containing two nonresolved replication forks in close proximity. (L) Model and examples of stalled replication foci containing two well-resolved replication forks in close proximity. See SI Appendix, Fig. S26 for individual color channels in K–L.

