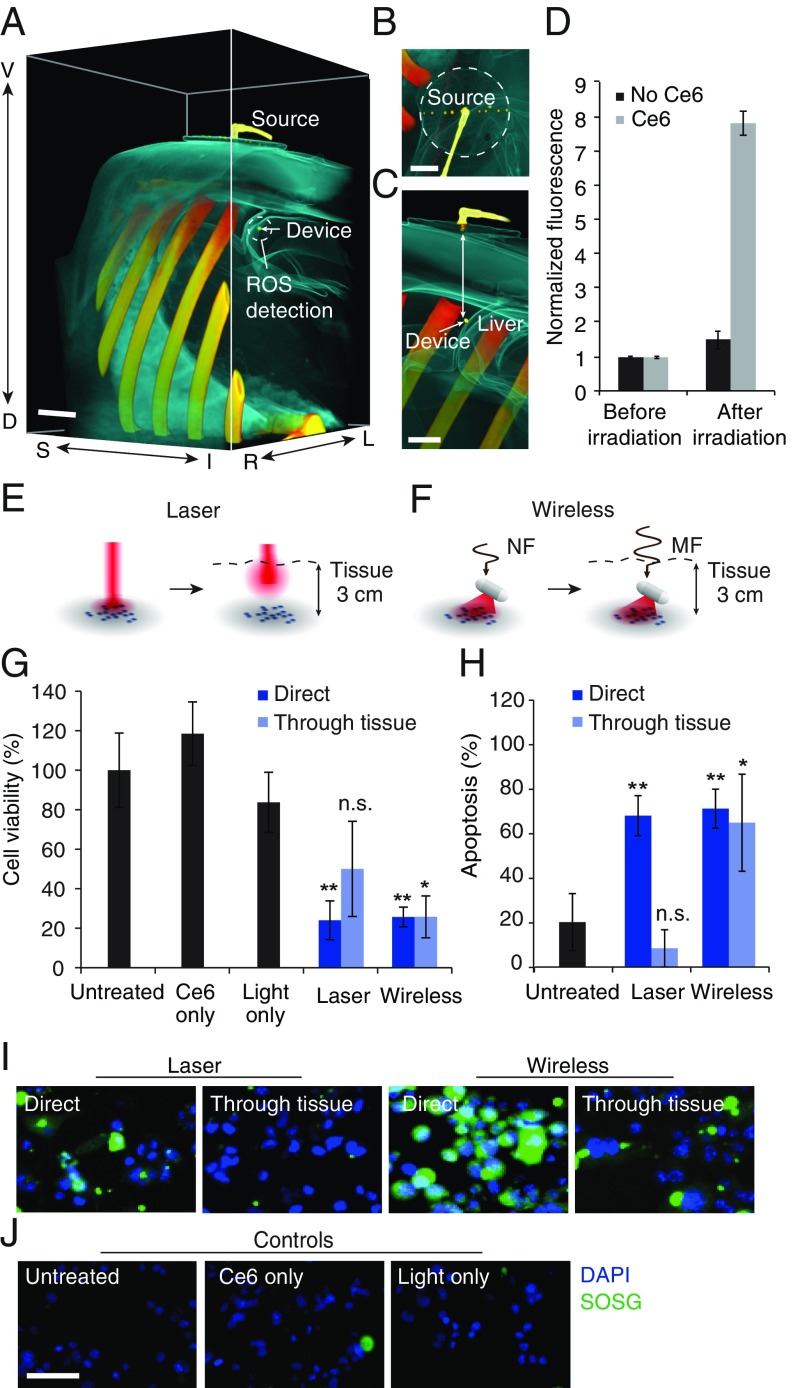
Fig. 3.
Deep-tissue PDT of tumor cells. (A–C) Three-dimensional CT reconstruction of wireless light delivery in adult pig model showing (A) abdominal region, (B) radio-frequency transmitter, and (C) cross section. The depth of the device from the surface is 5.1 cm. (Scale bar, 2 cm.) (D) ROS production in Ce6 solution around the device. Values are mean ± SD (n = 3 per group). (E and F) Illustration of light-delivery configuration for irradiating MB49 cells using (E) laser and (F) device, with and without intervening thick porcine tissue. Near-field (NF) wireless powering is used at close proximity and midfield (MF) for thick tissue. (G) Change in cell viability (MTS assay) following 20 min of irradiation in the above light-delivery configurations. Groups include untreated cells, cells exposed to Ce6 alone, cells exposed to light alone, and cells incubated with Ce6 and exposed to light from a laser or the device with or without intervening tissue section. (H) Apoptosis index (TUNEL assay) including positive and negative controls from the assay. (I and J) Fluorescence images showing ROS production (green) in (I) cells treated following incubation with Ce6 and illumination in the two light-delivery configurations and (J) control cells left untreated or administrated light or Ce6 only. Blue: DAPI, green: SOSG. (Scale bar, 50 μm.) The light-dosing rate is 1.3 mW throughout. Graphs show mean ± SD (n = 3 per group). **P < 0.01 and *P < 0.05.

