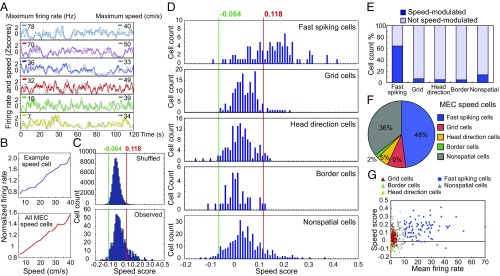
Fig. 1.
Most speed-modulated MEC cells are fast-spiking. (A) Traces show z scores for firing rate (color) and speed (gray) of six representative MEC speed cells during 2 min of free foraging. Maximum values of instantaneous firing rate and running speed are indicated (left and right, respectively). (B) Normalized mean firing rate as a function of binned speed for a representative fast-spiking speed cell (Top) and the whole MEC speed cell population (Bottom). (C) Distributions of observed speed scores and 100 sets of shuffled data per cell. Red line shows the 99th percentile of the shuffled distribution (speed score of 0.118). Green line shows the first percentile (−0.064). (D) Frequency distributions show speed modulation of all MEC cell types. Cells with speed scores higher than the 99th percentile of the shuffled data were classified as speed cells. Fast-spiking cells show the strongest speed modulation. Cells with speed scores lower than the first percentile of the shuffled data were classified as negative speed cells. (E) Histogram shows percentage of positive speed cells in different cell populations. (F) Pie chart shows proportion of cell types within the positively modulated speed cell population in MEC. (G) Correlation between speed score and mean firing rate for all MEC cell types. Fast-spiking cells were defined as cells with a mean rate > 10 Hz.

