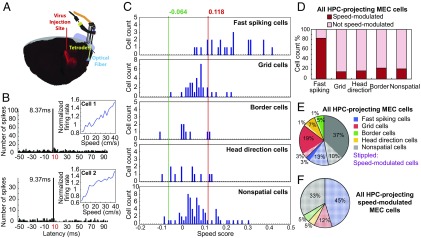
Fig. 2.
Speed cells in MEC project to the hippocampus (HPC). (A) Distribution of ChR2-expressing neurons of a rat injected with rAAV-ChR2-Flag in dorsal hippocampus. Schematic shows a sagittal brain section with virus injection site and recording site with local blue light emission, as well as microdrive and cement on skull. Flag-tagged ChR2 (red) was detected in both HPC and MEC. (B) Representative speed cells in MEC of two different rats. Cells were activated at minimal latencies in the population of responsive cells (8–10 ms). Cells received 1-Hz local flashes of 473-nm blue laser light. Line diagram shows the correlation between normalized mean firing rate and binned speed. Spike histogram shows distribution of spikes during the poststimulus interval. (C) Frequency distribution showing speed modulation of all hippocampus-projecting cell populations. Cell classification as in Fig. 1. (D) Histogram showing percentage of speed cells across cell groups for all hippocampus-projecting MEC cells. (E) Pie chart showing color-coded distribution of cell types with projections to the hippocampus. (F) Pie chart showing distribution of hippocampus-projecting speed cells in MEC.

