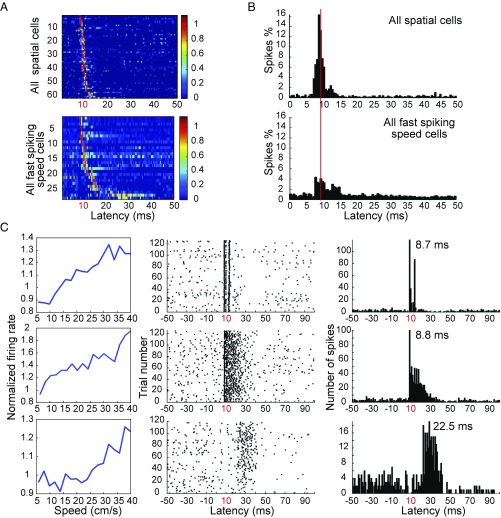
Fig. 4.
Fast-spiking speed cells are activated synaptically in MEC. (A) Color-coded spike rasters show latency distributions of light-responsive spatial cells including grid cells, border cells, and head direction cells (Top) as well as fast-spiking speed cells (Bottom) in MEC. The long tail of the distribution suggests that many of these cells were stimulated synaptically. (B) Spike histograms show the distribution of activity during the poststimulus interval for the entire cell sample. Distributions for spatially modulated speed cells (including head direction cells) and fast-spiking speed cells are shown separately (Top and Bottom, respectively). (C) Three representative fast-spiking speed cells activated at minimal latencies (8–10 ms) and/or at longer latencies (one cell per row). Line diagrams (Left) show correlation of normalized mean firing rate with binned speed of speed cells. Spike rasters (Center) show discharge in response to successive light stimuli. Peristimulus spike histogram (Right) shows distribution of spikes during the poststimulus interval. Rasters and histograms for these example cells appear also in ref. 24, without the speed modulation. Adapted from ref. 24, with permission.

