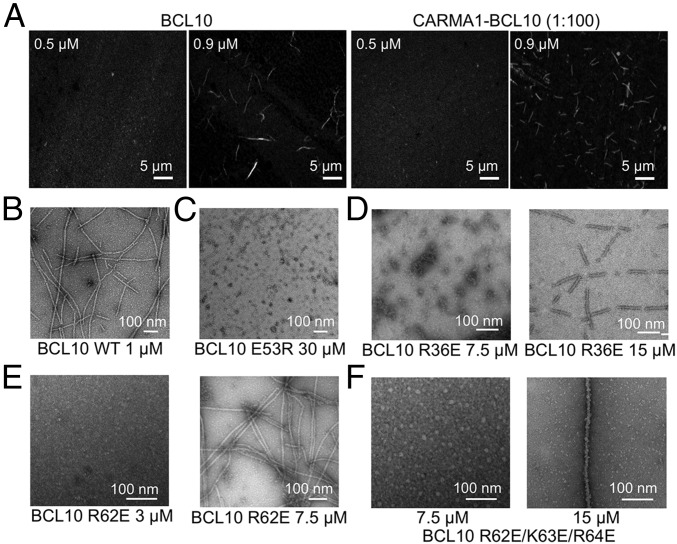
Fig. 2.
Assessment of critical concentrations of filament formation for WT and mutant BCL10. (A) Confocal imaging of BCL10 and the CARMA1–BCL10 complex at 0.5 μM and 0.9 μM showing filament formation at 0.9 μM but not at 0.5 μM. (B–F) Negative-staining EM images of WT BCL10 at 1 μM (B), BCL10 E53R at 30 μM (C), BCL10 R36E at 7.5 μM and 15 μM (D), BCL10 R62E at 3 μM and 7.5 μM (E), and BCL10 R62E/K63E/R64E at 7.5 μM and 15 μM (F).

