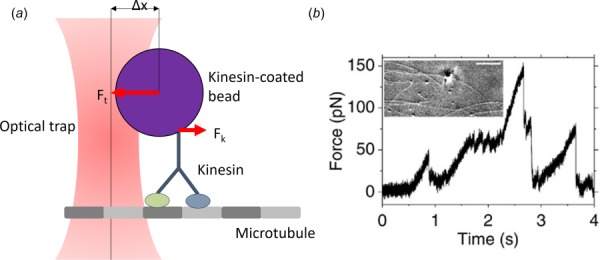
Fig. 3.

(a) A diagram of the optical trapping measurement technique. A bead is captured by the focused optical trap such that either a force is applied, or the escape force (Fk) generated by the protein to move the bead within the trap are met with a resistive force (Ft). (b) The motion of the bead can be tacked with DIC (as shown, image from Ref. [14], CC BY 3.0) or with fluorescent microscopy and related to the applied force.
