
Fig. 8.
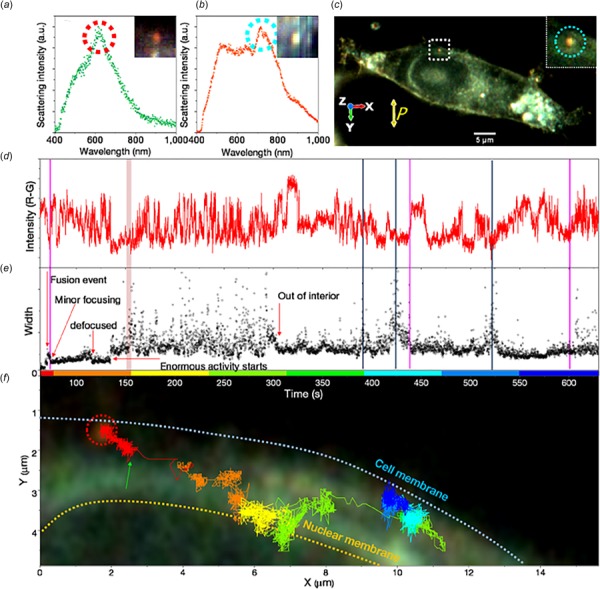
Study of 3D rotational dynamics of gold nanorods inside live HEK293 cells using CytoViva HSI system by Chaudhari and Pradeep [90]. (a) Scattering spectra of a single gold nanorod attached on the cell membrane. The inset shows the corresponding hyperspectral image. (b) Scattering spectra of the gold nanorod in (a) after being absorbed by the cell. The inset shows the corresponding hyperspectral image. (c) Actual image of cell being monitored to study rotational dynamics. The gold nanorod is marked with a square. Inset shows an enlarged view of the gold nanorod. Light scattered in the Z direction was collected through analyzer, whose orientation is shown by yellow double arrow. (d) Time variation of scattering intensity of the gold nanorod. Time scale corresponds to the axis of the graph shown below. Pink vertical bars show the region where microscope focus was adjusted on the particle after it went out of the focal plane. (e) Time variation of width of gold nanorod spot in two-dimensional Gaussian width of the gold nanorod. See Chaudhari and Pradeep [90] for further details. (f) Representation of gold nano particle path inside the HEK293 cell. Green arrow shows the time point from where temporal data of the GNR is shown. Color of the trace corresponds to the time scale of graphs (D, E). Please note that the background image is just to give a rough idea of the position of GNR inside the cell.