
Fig. 9.
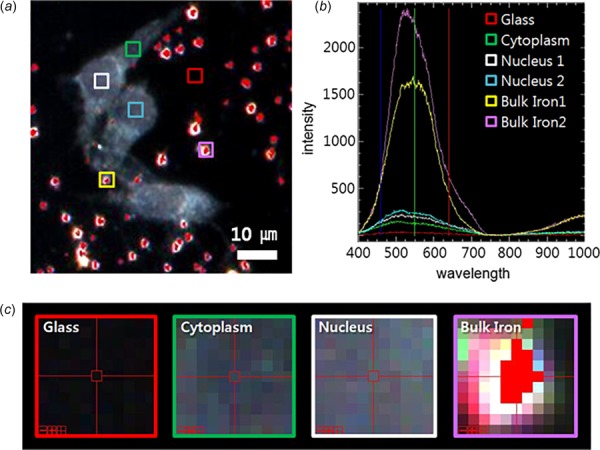
Hyperspectral fluorescence imaging of SHSY5Y cells containing iron from Oh et al. [18]. (a) Dark-field images of the SHSY5Ycells incubated with iron (specifically ferric ammonium nitrate) for 1 h. The areas mapped with HSI are marked by colored boxes. (b) Spectral profiles collected from each region shown in (a). Peaks are mainly observed between 450 to 650 nm. All bulk iron areas have a peak absorbance near 600 nm, whereas the peak signal in the cells is near 500 nm and the signal on the glass plate is almost zero. (c) Magnified or zoomed-in images (17×) of pixels containing HSI data from glass, cytoplasm, nucleus, and bulk iron.