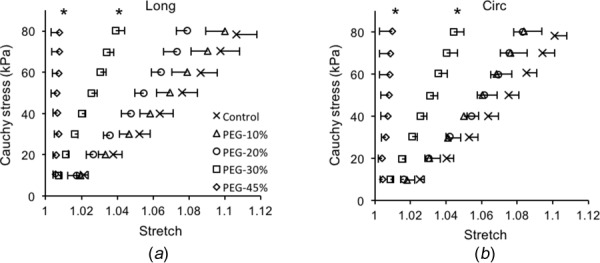
Fig. 7.

Average Cauchy stress versus stretch curves in the (a) longitudinal and (b) circumferential directions of control (n = 10) and PEG-treated elastin (n = 5 for 10%, 20%, and 30% PEG; n = 4 for 45% PEG). One-sided error bars of a standard error of the mean are shown in both directions (*p < 0.05).
