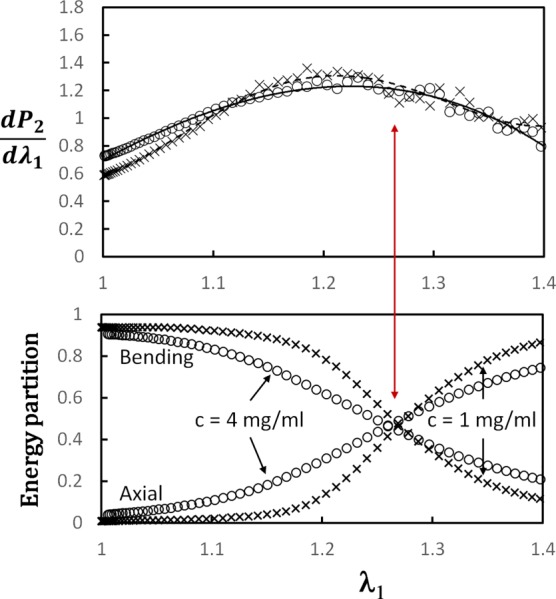
Fig. 8.

Variation of the incremental orientation index, , for models with collagen concentration c = 1 mg/ml (crosses) and c = 4 mg/ml (open circles), along with the energy partition for the same models and loading history. The energy stored in the bending and axial modes is shown. The contribution of the shear and torsional modes is smaller than 10% in all cases and is not shown. The transition from the bending-dominated state at small stretches to the axial dominance observed at large stretches (crossing of curves in the lower figure) corresponds to the peak in the incremental (shown by the red arrow).
