
Figure 5.
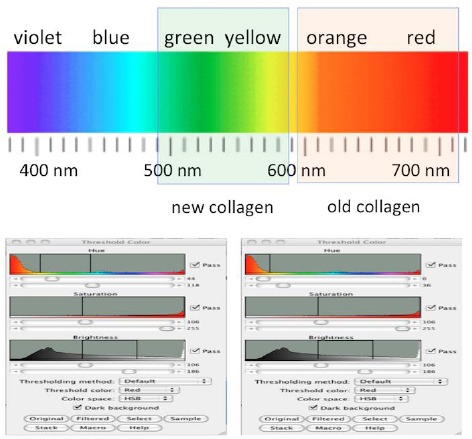
The tool used for computerised morphometric analysis is represented (in detail described in Materials and Methods), with the selected colour bands which have permitted the selected evaluation of the green/yellow and the red/orange fibres. The tool “Adjust colour threshold” was used for segmentation of sampling areas, extracting from each preparation the green/yellow appearing thin fibres and the red/orange appearing thick fibres to be evaluated