
Figure 7.
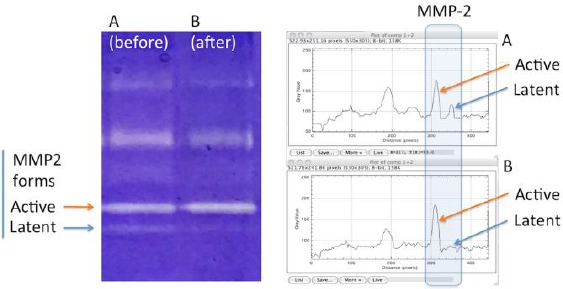
Zymograms obtained by electrophoresis and related densitometry plots of activity bands of active and latent MMP-2 forms from a) control, and b) following treatment
Official websites use .gov
A
.gov website belongs to an official
government organization in the United States.
Secure .gov websites use HTTPS
A lock (
) or https:// means you've safely
connected to the .gov website. Share sensitive
information only on official, secure websites.
Zymograms obtained by electrophoresis and related densitometry plots of activity bands of active and latent MMP-2 forms from a) control, and b) following treatment