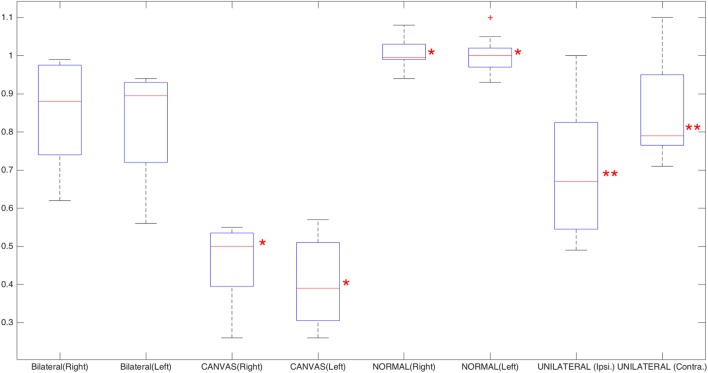
Figure 6.
Box plot of the leftward and rightward visually enhanced VOR gains for normal, cerebellar ataxia, neuropathy, and vestibular areflexia syndrome (CANVAS), and bilateral vestibulopathy groups; for unilateral vestibulopathy group, operated (neurectomy) and non-operated sides have been plotted. Red asterisks mark the CANVAS and healthy groups; these two groups show significant statistical differences when compared to all the other groups, based on analysis of variance statistical method. Double red asterisks mark the differences between the operated and non-operated side in the unilateral vestibulopathy group (Wilcoxon test). The red crosses are outliers.

