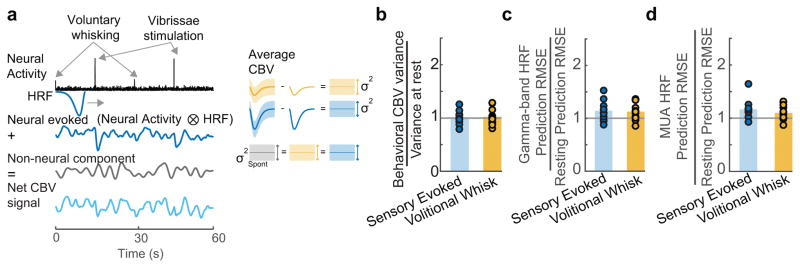
Figure 4. Variance of residual signal is similar across behavioral states.
a: Schematic illustrating the hypothesis that the measured hemodynamic signal (bottom left, light blue) is comprised of a neural evoked CBV component (top left, dark blue) and a separate, additive CBV component which is uncorrelated with the measured local neural activity (middle left, gray). The neural evoked CBV component can be subtracted out using the mean response from a given behavior (top right, middle right). The variance of the residuals after subtracting the neurally-driven CBV component will be equal to the variance of the additive CBV component (bottom right). b: Consistent with hypothesis a, the variance in the mean CBV response after subtraction of the mean-evoked response was not significantly different from the variance in the CBV during rest (t-test: Sensory evoked: p=0.86, t(11)=−0.18; Whisking: p=0.61, t(11)=0.52). Each circle represents a single animal (n=12), bar indicates the mean. c: Comparison of the root mean squared error (RMSE) of the gamma-band derived HRF during stimulation and volitional whisking normalized by the RMSE during rest for all animals (n=12). Bars indicate the mean across animals. The RMSE was similar between behaviors for the gamma-band (t-test, Bonferroni corrected, Sensory Evoked vs. Rest: p=0.06, t(11)=2.70; Sensory Evoked vs. Whisk: 0.73, t(11)=0.35, Volitional Whisk vs. Rest: p=0.07, t(11)=2.66) d: Same as c, but for MUA derived HRF predictions (Wilcoxon signed rank, Bonferroni corrected, sensory evoked vs rest: p=0.01, z=2.90, sensory evoked vs. whisk: p=0.18, z=1.33, whisk vs. rest: p=0.07, z=2.27).

