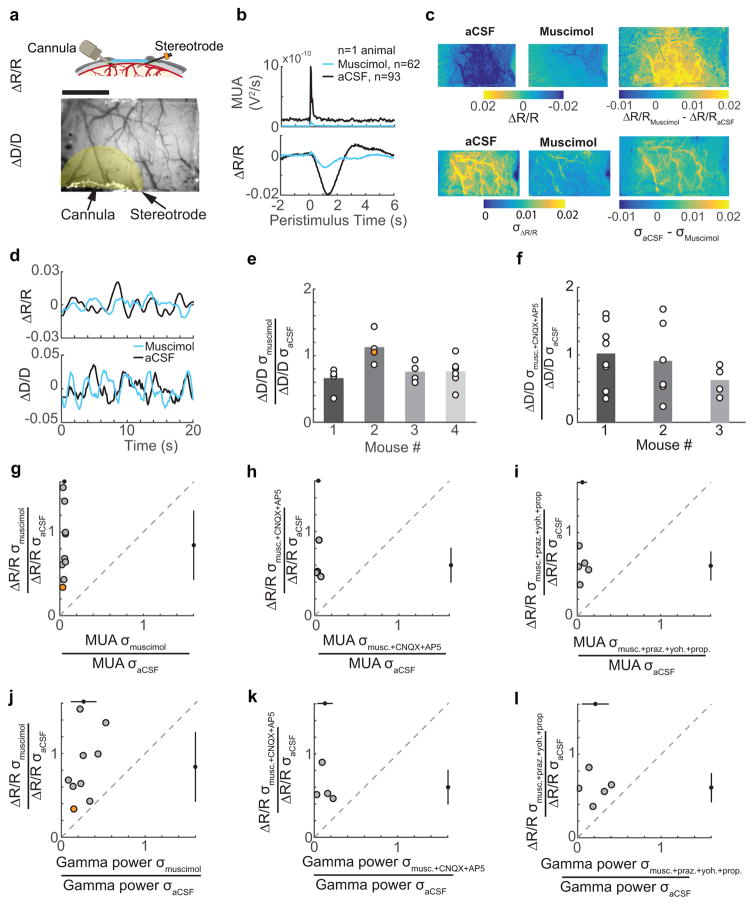
Figure 5. Spontaneous CBV fluctuations continue in the absence of neural activity and noradrenergic input.
a: Top: schematic of the window-electrode-cannula preparation. Bottom: an image of a thinned-skull window with cannula and electrode implants. The shaded yellow area indicates the ROI for CBV measurements. Scale bar = 1 mm. b: The average stimulation-evoked MUA following muscimol (n=62 stimuli) and aCSF (n=93 stimuli) infusion in a representative animal, showing reduced baseline and sensory evoked MUA (top) and average stimulation-evoked increase in CBV (bottom) within the ROI in (a). c: The average normalized pixel-wise CBV response to contralateral whisker stimulation (0.5–2 seconds after stimulation) across the thinned skull window for a single animal after aCSF infusion (top left, n=93 stimuli) and after infusion of muscimol (top center, n=62 stimuli). Top right shows the difference between aCSF infusion and muscimol infusion in the stimulation-triggered CBV response. The root-mean squared deviation (σ) of resting CBV across the thinned skull window after aCSF infusion (bottom left) and after muscimol infusion is shown in the bottom center. The difference in the magnitude of the fluctuations under both conditions is shown in the bottom right. Example shows the same animal depicted in a and b. d: Example of resting CBV fluctuations following aCSF (black) and muscimol (blue) infusions in a single animal (top, same animal as in a). Bottom, normalized diameter measurements were made from a single pial arteriole with 2-photon laser scanning microscopy following aCSF (black) and muscimol (blue) infusions from a single animal during periods of rest. e: Population summary of the root mean-square deviation in pial arteriole diameters (circles, n=19) after muscimol infusion for four animals. Orange circle is the arteriole in lower plot in d. Bars indicate the mean for each animal. Vessel diameter oscillations were reduced following infusion of muscimol compared to aCSF (Mixed-effects ANOVA, p=0.0015, t(36)=3.43) f: Same as e, except for measurements taken after infusion of muscimol+CNQX+AP5 cocktail. There was no significant difference in the amplitudes of the normalized diameter fluctuations between muscimol+CNQX+AP5 and aCSF infusions (Mixed-effects ANOVA, n=18 vessels in 3 animals, p=0.22, t(34)=1.26). g: A comparison of the root mean-square deviation of resting MUA and CBV fluctuations. Black circles and bars outside the axes show the populations mean and standard deviation. Orange circle is the mouse in a–c. The dashed gray line is the unity line. h: Same as g, except with a muscimol+CNQX+AP5 cocktail infusion. The resting CBV oscillation amplitude was not reduced compared to muscimol-only infusions (n=4, unpaired t-test, one sided, p=0.15, t(11)=1.11). i: Same as g, except with an infusion of muscimol+prazosin+yohimbine+propranolol cocktail. The resting CBV oscillation was not significantly reduced as compared to muscimol-only infusions (n=5, unpaired t-test, one-sided, p=0.12, t(12)=1.24) j: The root mean squared deviation of gamma-band neural power compared to CBV during periods of rest following muscimol infusion for all animals. Black circles and bars outside the axes show the populations mean and standard deviation. k: Same as j, but for infusion of muscimol+CNQX+AP5 cocktail. The resting gamma band power oscillations were reduced 87% compared to the control, but were not significantly different from reductions due to muscimol-only infusions (unpaired t-test, one-sided, p=0.06, t(11)=1.73). l: Same as j, but for an infusion of muscimol+prazosin+yohimbine+propranolol cocktail. The oscillations in gamma-band power were reduced 79% compared to aCSF control, which was not significantly different from muscimol-only infusions (unpaired t-test, two sided, p=0.52, t(12)=0.66).

