Fig. 3.

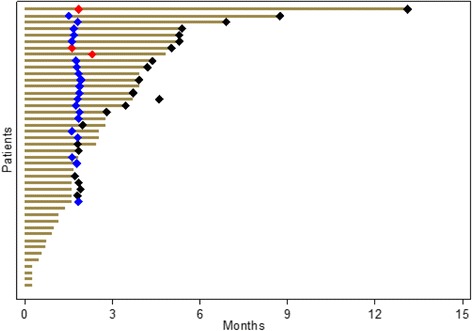
Swimmer plot indicating the number of patients treated with temsirolimus as a function of treatment duration. Red diamonds: PR; blue diamonds: SD; black diamonds: progression or death

Swimmer plot indicating the number of patients treated with temsirolimus as a function of treatment duration. Red diamonds: PR; blue diamonds: SD; black diamonds: progression or death