
Fig. 2.
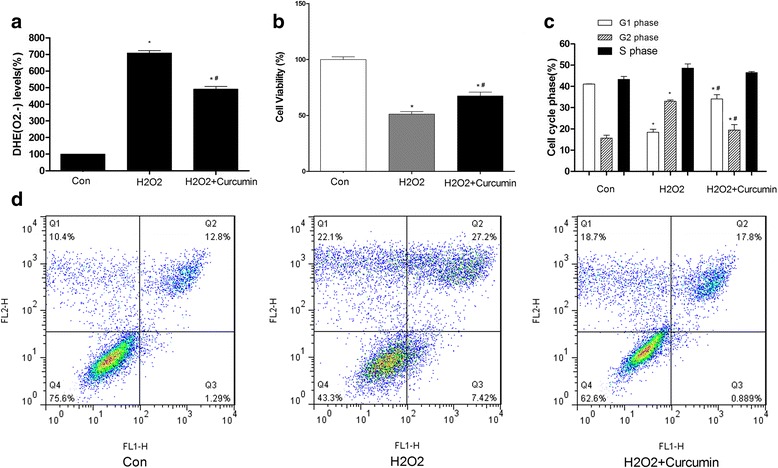
The concentration of intracellular ROS (a), cell viability (b), cell cycle (c), and cell apoptosis (d) in the control, H2O2, and H2O2 + Curcumin groups. * P < 0.05 compared with the control group, # P < 0.05 compared with the H2O2 group
Official websites use .gov
A
.gov website belongs to an official
government organization in the United States.
Secure .gov websites use HTTPS
A lock (
) or https:// means you've safely
connected to the .gov website. Share sensitive
information only on official, secure websites.
The concentration of intracellular ROS (a), cell viability (b), cell cycle (c), and cell apoptosis (d) in the control, H2O2, and H2O2 + Curcumin groups. * P < 0.05 compared with the control group, # P < 0.05 compared with the H2O2 group