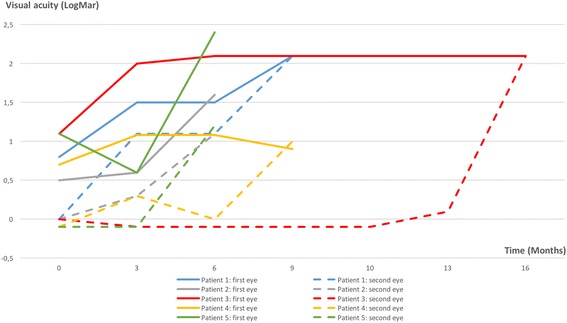
Fig. 2.

Graph displaying the visual acuities of included patients (full lines indicate the visual acuity in the first involved eye and dotted lines indicate visual acuity in the second involved eye. Blue lines: patient 1; grey lines: patient 2; red lines: patient 3; yellow lines: patient 4; green lines: patient 5
