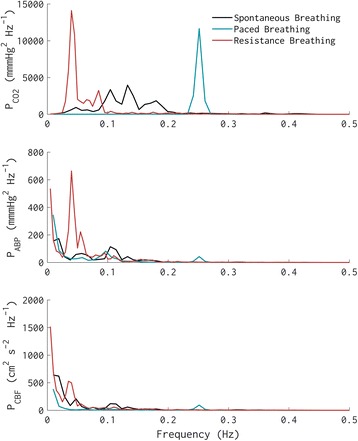
Fig. 3.

The magnitude of fluctuations (i.e., spectral power) in end-tidal CO2 (as a surrogate for respiration; top panel), systemic arterial blood pressure (middle panel), and cerebral blood flow velocity (bottom panel) during spontaneous breathing, paced breathing (at 0.25 Hz; 15 bpm), and resistance breathing (~ 10–20 cmH2O resistance, lower panel). Note the marked increase in the magnitude of arterial pressure fluctuations below 0.1 Hz (i.e., slower than 10 s) during resistance breathing, due to increased slow fluctuations in respiration, and thus in intrathoracic pressure. Also note the lack of an increase in cerebral blood flow fluctuations in the same frequency band, indicative of effective cerebral autoregulation
