Fig. 3.

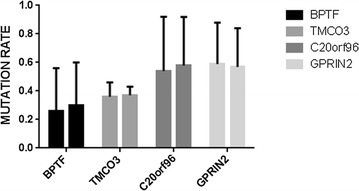
Correlations of BPTF, TMCO3, GPRIN2, and C20orf96 mutation rate of plasma cfDNA, and bone marrow gDNA: correlation analysis showed that the mutation rate of plasma cfDNA were in positive correlation with gDNA of bone marrow (P = 0.001)

Correlations of BPTF, TMCO3, GPRIN2, and C20orf96 mutation rate of plasma cfDNA, and bone marrow gDNA: correlation analysis showed that the mutation rate of plasma cfDNA were in positive correlation with gDNA of bone marrow (P = 0.001)