Fig. 2.

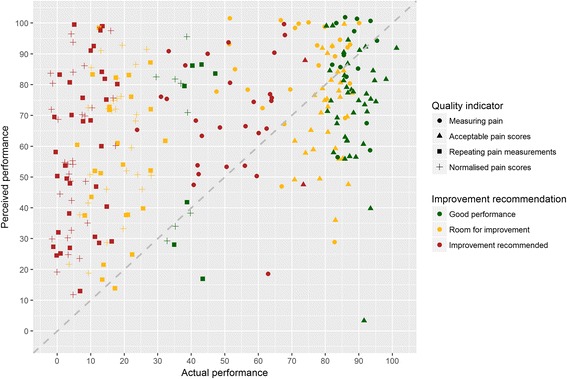
Scatter plot of intensive care professionals’ perceived clinical performance compared to their actual performance (above diagonal line = overestimation; below = underestimation)

Scatter plot of intensive care professionals’ perceived clinical performance compared to their actual performance (above diagonal line = overestimation; below = underestimation)