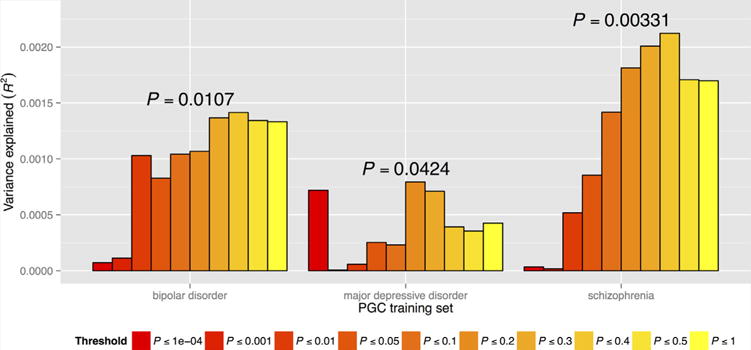
FIG. 2.

Predictive value of bipolar disorder, major depressive disorder, and schizophrenia polygene scores. Results based on varying SNP P-value inclusion thresholds are grouped by “training set.” Proportion of variance explained (Nagelkerke’s pseudo-R2) is shown on y-axis, and represents comparison of family history positive and negative cases. Displayed P-values correspond to the inclusion thresholds yielding the largest proportion of variance explained and are one-sided [Color figure can be seen in the online version of this article, available at http://wileyonlinelibrary.com/journal/ajmgb].
