Figure 3.
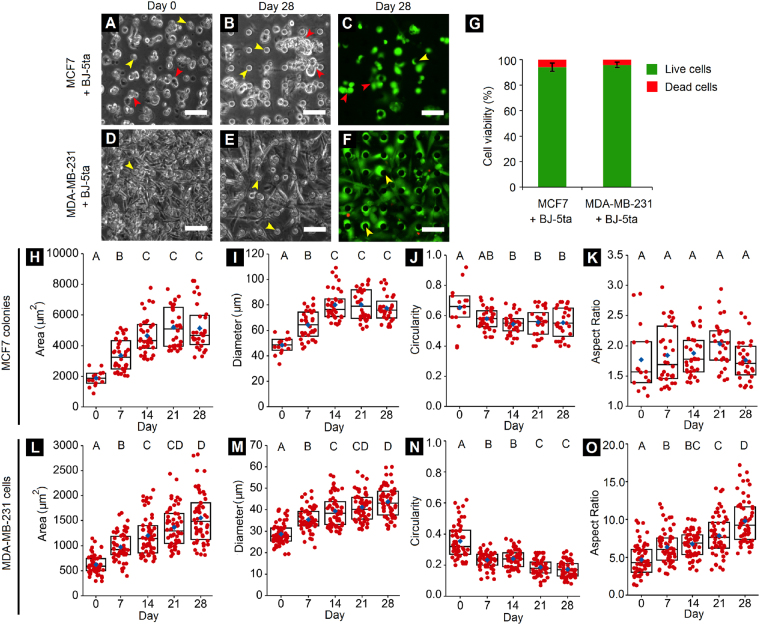
Cancer-fibroblast long-term 3D co-culture and morphological quantification. (A,B) MCF7 breast cancer cells and BJ-5ta fibroblasts co-encapsulated in PEG-fibrinogen hydrogel matrix within tumor-mimetic chips and maintained in culture for 28 days. (C) Live/Dead staining of cells (calcein AM, green; ethidium homodimer, red) demonstrates cell viability within chips (Red arrowheads indicate MCF7 colonies). (D,E) MDA-MB-231 breast cancer cells and BJ-5ta fibroblasts maintained in 3D culture within chips and (F) Stained for viability in a similar manner as MCF7 cells (yellow arrowheads indicate PDMS pillars of height 100 μm that support the 3D tumor chamber; Scale bar = 50 μm). (G) Quantification of viability within chips on day 28 of culture revealed high long-term cell viability both cancer cell types (n = 6 representative images from 3 independent chips per condition, error bars represent standard deviation). (H–K) Quantification of MCF7 colony morphology indicated increasing colony size and colony spreading over 28 days. (L–O) Quantification of MDA-MB-231 cell morphology exhibited increased cell spreading and elongation over 28 days. Red points denote individual MCF7 colonies/MDA-MB-231 cells and blue diamonds represent mean of respective groups. Rectangular boxes represent upper quartile, median and lower quartile of respective group. Groups having different letters have significantly different means (p < 0.05); n = minimum 15 MCF7 colonies and minimum 50 MDA-MB-231 cells from 3 independent chips per time point.

