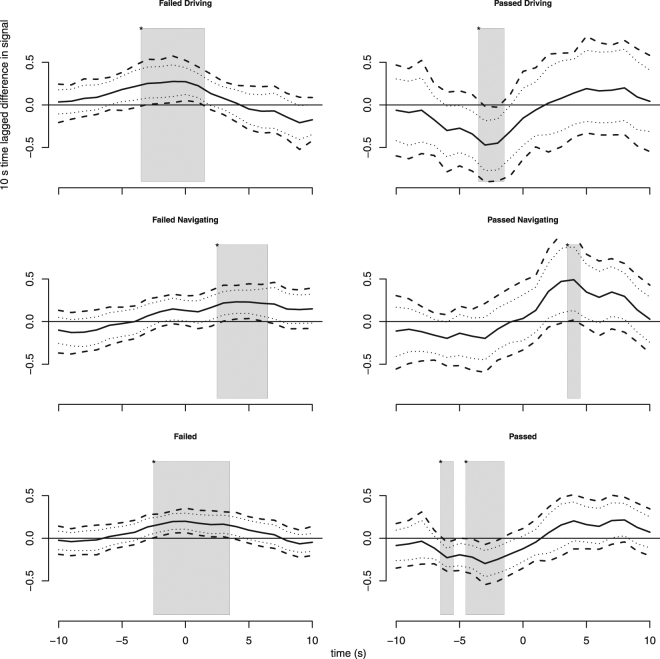
Figure 3.
The grand averages of SCR 10 second time-lagged difference in time windows of −10 to 10 seconds. The figure illustrates the change in signal levels in different conditions. Times of significant signal change have grey background. Dashed lines show confidence bands derived using MWE67. The MWE’s contain 95% of the bootstrapped difference curves. Dotted lines show naive univariate 95% bootstrapped confidence intervals for each time point.

