Figure 5.
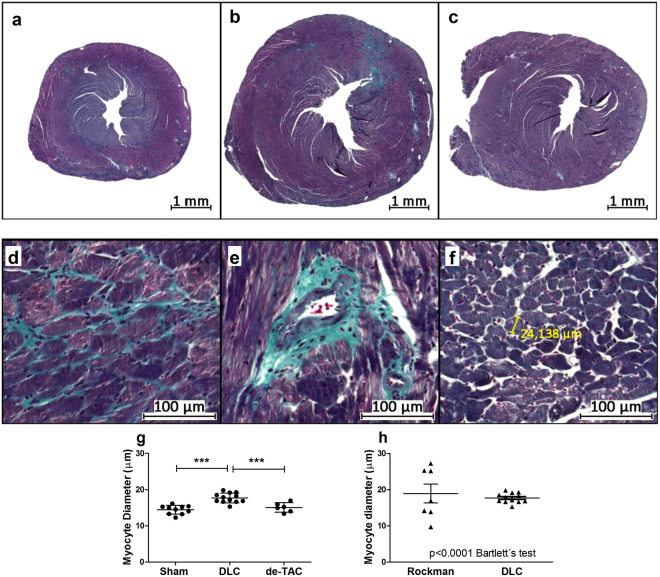
Myocardial histological changes after TAC with the DLC technique. Macrophotographies of LV sections stained with Masson trichrome of (a) a control mouse, and mice subjected to (b) TAC and (c) TAC and de-TAC. Light microscopic studies revealed (d) interstitial and (e) perivascular fibrosis, and allowed (f) morphometric assessment of the cardiomyocytes. (g) Cardiomyocyte diameter increased after TAC in the endocardial stratum of the posterior wall. These changes regressed after release of the aortic constriction. (h) The dispersion of myocyte diameter values after TAC was significantly greater with Rockman’s technique than with DLC (Bartlett’s test). Comparisons in G with one way ANOVA. **p < 0.01; ***p < 0.001. DLC: Double loop-clip.

