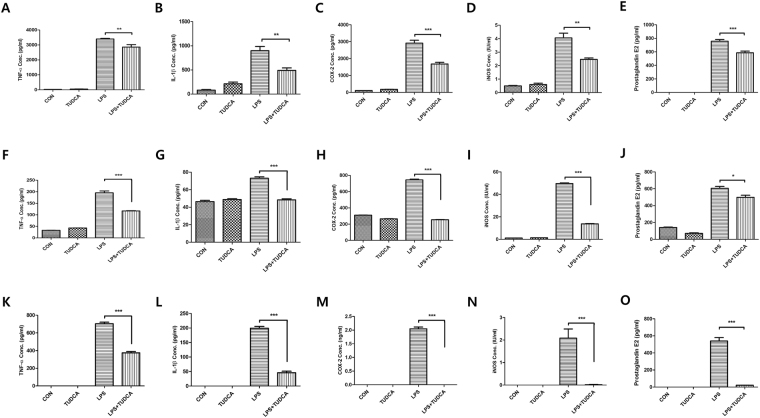
Figure 4.
The protein concentration in RAW 264.7 macrophages, BV2 microglial cells, and BMMs treated with TUDCA (500 µM) or LPS (1 µg/mL) or LPS containing TUDCA. The macrophages, BV2 microglial cells, and BMMs in the TUDCA group and in the LPS + TUDCA group were pretreated with 500 µM of TUDCA for 1 h before the zero time point. The LPS + TUDCA group was then treated with LPS (1 µg/mL) containing 500 µM of TUDCA for 24 h. The TUDCA group was treated with 500 µM TUDCA. The macrophages, BV2 microglial cells, and BMMs in the LPS group were treated with 1 µg/mL of LPS for 24 h. The collected supernatants were subjected to the plate of the ELISA kit to detect the proteins of (A,F,K) TNF-α, (B,G,L) IL-1β, (C,H,M) COX-2 (D,I,N) iNOS, and (E,J,O) PGE2. Results are the mean ± SD of triplicate experiments: *p < 0.05, **p < 0.01, and ***p < 0.001 significant difference as compared to each other by one-way ANOVA followed by Tukey’s post hoc analysis.

