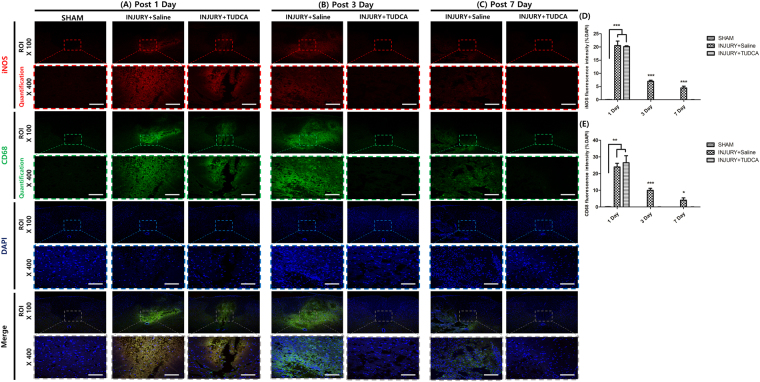
Figure 7.
Immunofluorescent staining for CD68 and iNOS. Lesion epicenter immunofluorescent staining: (A) On 1 day after SCI, the expressions of CD68 and iNOS were not significantly different. (B) On 3 day after SCI, the expressions of CD68 and iNOS were significantly suppressed by TUDCA. (C) On 7 days after SCI, the expressions of CD68 and iNOS were significantly suppressed by TUDCA (Scale bar = 80 µm). (D) Quantitative analysis of the fluorescence intensity for iNOS. (E) Analysis of the quantitative fluorescence intensity for CD68. Results are the mean ± SD of triplicate experiments: *p < 0.05, **p < 0.01, and ***p < 0.001 significant difference as compared to the control group for each time by one-way ANOVA followed by Tukey’s post hoc analysis.

