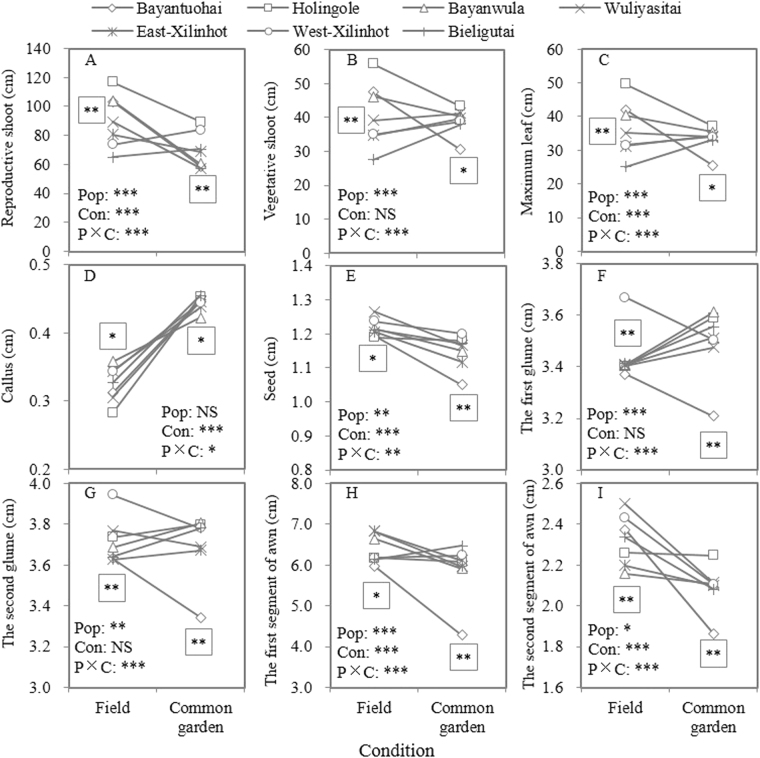
Figure 1.
Results of analysis of variance on quantitative traits of different S. grandis populations both in the field and in the common garden. *P < 0.05, **P < 0.01, ***P < 0.001. Stars without border indicate the significance of factors’ effects by two-way analysis of variance, while stars with square border indicate the significance of difference among populations in the field (left) or in the common garden (right) by one-way analysis of variance.

