Figure 2.
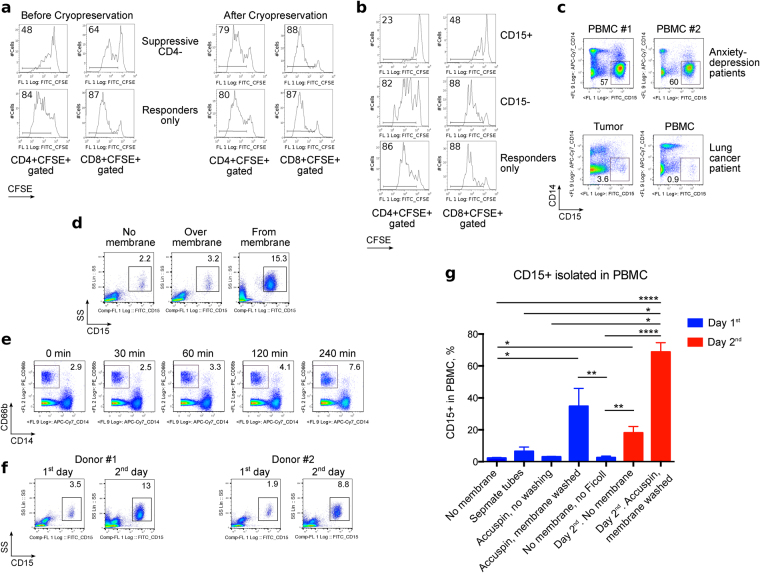
Myeloid origin of CD4− suppressive cells and factors that increase their isolation in PBMC layer. (a,b) Healthy donor PBMC were stimulated and co-incubated with suppressive cells. (a) CD4− were suppressive prior to cryopreservation (left), but not after it (right). Cryopreservation negated suppressive effects of CD4− cells. Data representative of two independent experiments. (b) PBMC from a lung transplant recipient were separated into CD15+ and CD15− subsets and used as suppressive cells. CD15+ cells strongly impaired PBMC proliferation. Data representative of three independent experiments. (c) Non-cryopreserved PBMC and tumor single cell suspension samples from a lung cancer patient and 2 anxiety/depression patients showed increased CD15+CD14− cells in the anxiety/depression samples. Data representative of four experiments, 11 samples in total. (d–g) Influence of isolation procedures on myeloid cell populations within PBMC samples. (d) Fresh lung transplant blood samples processed within 3 hours after blood draw, over Ficoll (“No membrane”) or in Accuspin tubes, where cells were collected from the PBMC layer exclusively (“Over membrane”) or washed from the membrane (“From membrane”); percent of CD15+ in each PBMC sample is indicated. Two experiments with two samples have been performed. (e) Whole blood samples were divided into aliquots, incubated on ice for the indicated times, and warmed to room temperature prior to PBMC isolation without membrane tubes. Cooling increased granulocyte contamination within the PBMC layer; 4 samples were evaluated in 3 experiments. (f) PBMC were isolated from blood samples within 3 hours of drawing (“1st day”) or on next day (“2nd day”), without membrane tubes. Overnight storage increased the fraction of CD15+ cells within isolated PBMC. Data represent 5 experiments with 7 samples. (g) Pooled data from 71 blood samples from 47 individuals, including lung cancer (n = 15), lung transplant (n = 22), adult kidney transplant (n = 1), and anxiety/depression (n = 3) patients, as well as healthy donors (n = 6). Data shown as Mean ± SEM (% CD15+ in PBMC), with *, **, ***, and **** indicating p < 0.05, p < 0.01, p < 0.001, and p < 0.0001, respectively (Kruskal-Wallis test with Dunn’s Multiple Comparison test). Presented histograms and dot plots consist of 29,263 ± 6,868 (Mean ± SEM) events.

